Exploratory Data Analysis(EDA) according to Wikipedia is an approach to analyzing data sets to summarize their main characteristics, often with visual methods. Primarily it is for seeing what the data can tell us beyond the formal modeling or hypothesis testing task. Too much theory? I know. That’s why we shall perform hands on EDA for IPL dataset found on Kaggle.
Note: The data set differs from the original stats. And hence any result of the EDA we performed will be void to the real world.
Problem Statement
The task is to analyze ball by ball data from all the way from 2008 to 2019. Using this we need to come up with analysis to form your own dream team for IPL. For year 2016, 2017 and 2018, we need to find out :- Find out most valuable player – explain why
- Find out most consistent batsman – explain why
- Find out most consistent bowler – explain why
- Find out, worst player – explain why
- Find out worst batsmen – explain why
- Find out worst bowler – explain why
- Rank top 25 players for the year 2016 to 2019
- Identify most improved player from 2018 to 2019
- Find out which stadium had the most runs and which scored the least
- Which bowler gave the least runs and took most wickets.(Economy)
- Design a super awesome dream team for 2020.
The First Steps
import numpy as np
import pandas as pd
import matplotlib.pyplot as plt
import seaborn as sns
Deliveries=pd.read_csv(r'innings_data.csv')Lets understand how the data format is and how exactly the data is.
Matches=pd.read_csv(r'match_data.csv')
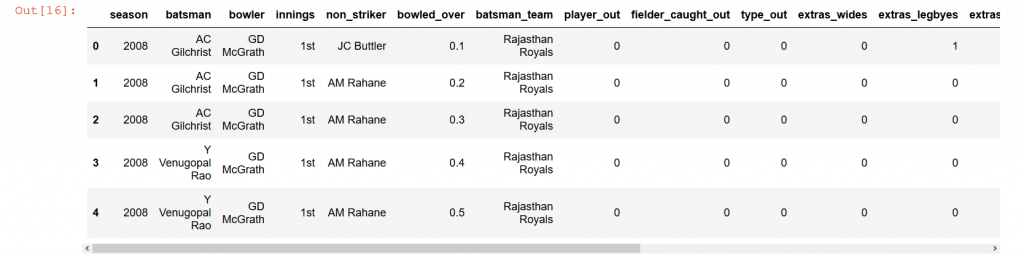
Deliveries.head()

Okay… We have some pretty interesting columns and might require preprocessing.
Let’s checkout [No pun intended] the matches.csv
Matches.head()
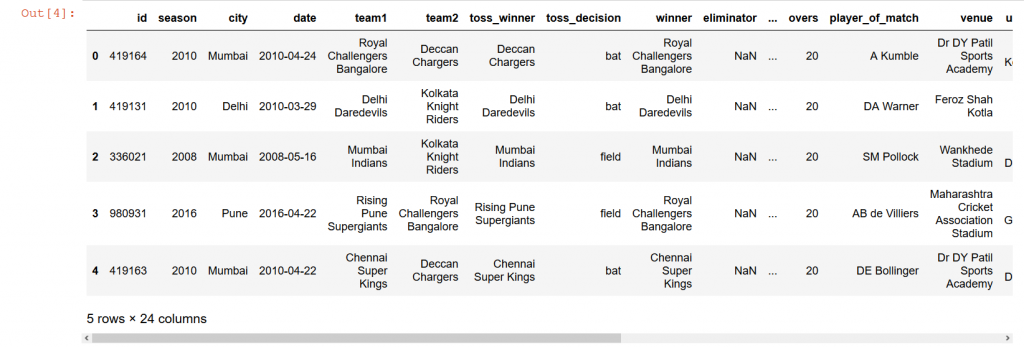
Great. One needs to understand that a very important step in solving any problem in data science is to understand how the data is, what the data is and how should the data be formatted in order to fit our needs or the problem statement.
Data Cleaning
Now that we took a small peek at how the structure of data is, we need to make sure that there are no null values in our dataset. It is very crucial that we eliminate null values as much as possible. It can either be done by eliminating those specific records itself or filling the null values. However, there is a catch in both the methods. If we remove every record that we stumble upon that has a null value then we might end up having very less data. Or if we fill the missing values using any methods, we lose the “essence” of the data. It is the job of a data scientist to understand, diagnose effectively what methods must be used to handle such cases. Let’s now check what percentage of values are missing in each column.Deliveries.isnull().sum()*100/Deliveries.shape[0]
id 0.00000Replacements?! (Duh!)
season 0.00000
batsman 0.00000
bowler 0.00000
innings 0.00000
non_striker 0.00000
replacements 99.98301
bowled_over 0.00000
batsman_team 0.00000
player_out 0.00000
fielder_caught_out 0.00000
type_out 0.00000
extras_wides 0.00000
extras_legbyes 0.00000
extras_noballs 0.00000
extras_byes 0.00000
extras_penalty 0.00000
total_extras_runs 0.00000
batsman_runs 0.00000
total_runs 0.00000
dtype: float64
Matches.isnull().sum()*100/Matches.shape[0]
id 0.000000Eliminator? Check. Result? Check. dl_applied? Check. umpire3? Double check. Other columns with missing values will be handled eventually.
season 0.000000
city 1.742627
date 0.000000
team1 0.000000
team2 0.000000
toss_winner 0.000000
toss_decision 0.000000
winner 1.608579
eliminator 98.927614
dl_applied 97.453083
win_by_runs 54.959786
win_by_wickets 46.648794
result 98.391421
overs 0.000000
player_of_match 0.536193
venue 0.000000
umpire1 0.134048
umpire2 0.134048
umpire3 99.731903
first_bat_team 0.000000
first_bowl_team 0.000000
first_bat_score 0.000000
second_bat_score 0.268097
dtype: float64
print('Deliveries Details')
print('Shape: ',Deliveries.shape)
print('Size: ',Deliveries.size)
print('Dimensions: ',Deliveries.ndim)
Deliveries Details
Shape:  (176573, 20)
Size:  3531460
Dimensions:  2
print('Matches Details')
print('Shape: ',Matches.shape)
print('Size: ',Matches.size)
print('Dimensions: ',Matches.ndim)
Matches Details
Shape:  (746, 24)
Size:  17904
Dimensions:  2
Matches=Matches.sort_values('id')
#We can see that the id-s of the matches are not sorted and hence the sorting.
Deliveries.dtypes
id                      int64
season                  int64
batsman                object
bowler                 object
innings                object
non_striker            object
replacements           object
bowled_over           float64
batsman_team           object
player_out             object
fielder_caught_out     object
type_out               object
extras_wides            int64
extras_legbyes          int64
extras_noballs          int64
extras_byes             int64
extras_penalty          int64
total_extras_runs       int64
batsman_runs            int64
total_runs              int64
dtype: object
Matches.dtypes
id int64Now we have the overview of the entire data. We know what columns have missing values, we know what its data types are. It is time to make changes into our dataframe to fit our purpose.
season int64
city object
date object
team1 object
team2 object
toss_winner object
toss_decision object
winner object
eliminator object
dl_applied object
win_by_runs float64
win_by_wickets float64
result object
overs int64
player_of_match object
venue object
umpire1 object
umpire2 object
umpire3 object
first_bat_team object
first_bowl_team object
first_bat_score float64
second_bat_score float64
dtype: object
Deliveries.drop(['replacements','id'],inplace=True,axis=1)
#Remove replacements and id
Deliveries['type_out'].replace('[a-zA-z \s]+','1',regex=True,inplace=True)
#The type_out is of the form stump or run out and we don't really need that information
#hence we are replacing that with 1
Deliveries['type_out']=Deliveries['type_out'].astype(int)
print(Deliveries.isnull().sum())
Deliveries.head()
season                0
batsman               0
bowler                0
innings               0
non_striker           0
bowled_over           0
batsman_team          0
player_out            0
fielder_caught_out    0
type_out              0
extras_wides          0
extras_legbyes        0
extras_noballs        0
extras_byes           0
extras_penalty        0
total_extras_runs     0
batsman_runs          0
total_runs            0
dtype: int64
Sweet!!
Let’s proceed with the changes in the Matches dataframe.
Matches.drop(['id','eliminator','result','umpire3','dl_applied'],inplace=True,axis=1)
Matches['city'].fillna('unknown',inplace=True)
Matches['winner'].fillna('No Result',inplace=True)
Matches['player_of_match'].fillna('unknown',inplace=True)
Matches['umpire1'].fillna('unknown',inplace=True)
Matches['umpire2'].fillna('unknown',inplace=True)
Matches['second_bat_score'].fillna(0,inplace=True)
Matches['win_by_runs'].fillna(0.0,inplace=True)
Matches['win_by_wickets'].fillna(0.0,inplace=True)
Matches.isnull().sum()
season 0Sweet stuff again!!
city 0
date 0
team1 0
team2 0
toss_winner 0
toss_decision 0
winner 0
win_by_runs 0
win_by_wickets 0
overs 0
player_of_match 0
venue 0
umpire1 0
umpire2 0
first_bat_team 0
first_bowl_team 0
first_bat_score 0
second_bat_score 0
dtype: int64
Matches['win_by_runs']=Matches['win_by_runs'].astype(int)
Matches['win_by_wickets']=Matches['win_by_wickets'].astype(int)
Matches.head()
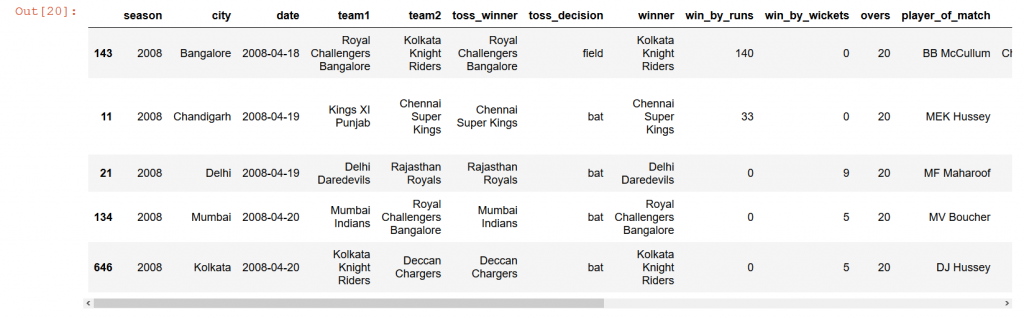
Until here, all that we did was prepare our data for analysis. We got an overview of the data, looked out for missing values and handled everything like a boss. So this was the part – 1 of the EDA we will be performing. It was quite simple and small. The next part will have the entire analysis, till then try the problem and see where it leads you to. This task was given to us (Nithin and Pareekshith) at Ambee during our internship.
Cya.